multiNetX v1.0
|
multiNetX is a python package for the manipulation and visualization of multilayer networks. The core of this package is a MultilayerGraph, a class that inherits all the features of networkx.Graph(). multiNetX inheriths all features from NetworkX Features:
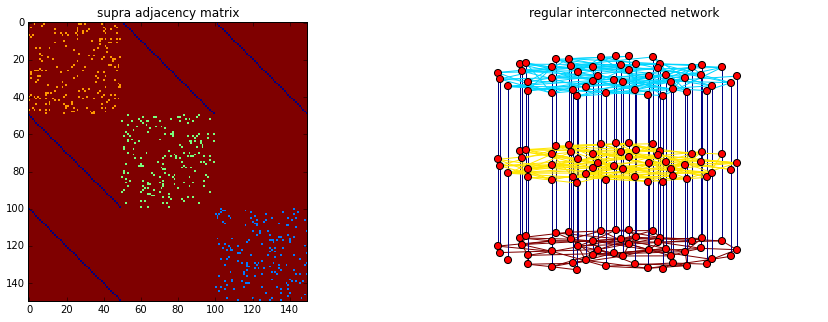
https://github.com/nkoub/multinetx Any feedback or contribution to the code is more than welcome! multiNetX is part of the deliverables of the LASAGNE project (multi-LAyer SpAtiotemporal Generalized NEtworks), EU/FP7-2012-STREP-318132 (http://complex.ffn.ub.es/~lasagne/) and is distributed under the GNU General Public License. ##Import standard libraries import numpy as np import matplotlib.pyplot as plt ##Import the package MultiNetX import multinetx as mx ##Create three Erd"os- R'enyi networks with N nodes for each layer N = 50 g1 = mx.erdos_renyi_graph(N,0.07,seed=218) g2 = mx.erdos_renyi_graph(N,0.07,seed=211) g3 = mx.erdos_renyi_graph(N,0.07,seed=208) ##Define the type of interconnection between the layers adj_block = mx.lil_matrix(np.zeros((N*3,N*3))) adj_block[0: N, N:2*N] = np.identity(N) # L_12 adj_block[0: N,2*N:3*N] = np.identity(N) # L_13 #adj_block[N:2*N,2*N:3*N] = np.identity(N) # L_23 adj_block += adj_block.T ##Create an instance of the MultilayerGraph class mg = mx.MultilayerGraph(list_of_layers=[g1,g2,g3], inter_adjacency_matrix=adj_block) mg.set_edges_weights(inter_layer_edges_weight=4) mg.set_intra_edges_weights(layer=0,weight=1) mg.set_intra_edges_weights(layer=1,weight=2) mg.set_intra_edges_weights(layer=2,weight=3) ##Plot the adjacency matrix and the multiplex networks fig = plt.figure(figsize=(15,5)) ax1 = fig.add_subplot(121) ax1.imshow(mx.adjacency_matrix(mg,weight='weight').todense(), origin='upper',interpolation='nearest',cmap=plt.cm.jet_r) ax1.set_title('supra adjacency matrix') ax2 = fig.add_subplot(122) ax2.axis('off') ax2.set_title('regular interconnected network') pos = mx.get_position(mg, mx.fruchterman_reingold_layout(mg.get_layer(0)), layer_vertical_shift=1.4, layer_horizontal_shift=0.0, proj_angle=7) mx.draw_networkx(mg,pos=pos,ax=ax2,node_size=50,with_labels=False, edge_color=[mg[a][b]['weight'] for a,b in mg.edges()], edge_cmap=plt.cm.jet_r) plt.show()
|